Continuing with the theme of highlighting the core tenets of managing a Digital TV Programme, having previously discussed the following ingredients of a typical delivery:
Regardless of whether your business is a software vendor delivering components to an Operator, or an Operator managing deliveries from several component vendors, the topics discussed in this post are relevant to both Operators and Vendors alike. As a software component vendor it is in your best interest to prove to your customer, the Operator, that your products are built from sound engineering principles, your quality assurance is second-to-none, and you can guarantee a level of component quality that more than meets the expectations of your customer, the PayTV Operator.
As an Operator, you are so busy managing your operations, that your business is much larger than just managing new technical projects, that you're forced to impose quality criteria on your projects. If this is not something you're already used to doing, then IMHO, you're overlooking a crucial element of your project's success. Where relationships between vendors are good, and proven from past experience and deployments of past products, then your can rely on the element of trust. But in cases where you're taking a risk in adopting new technologies, then it is your responsibility to ensure that Quality Criteria are well defined and acceptable - and ultimately accepted by your vendors. If you haven't done this already, then you need to re-consider, especially when the expectations are high.
This is a massive post, broken up into the following topics:
Battle-scars (Real-world Project Experience)
Taking a chapter out from a past project experience around the time 2007-2010: An Operator embarked on a programme to replace its existing subscriber-base of deployed HDPVR software with new technology from a different Middleware vendor (company I worked for, I was Development Owner for the Middleware). This new technology that was not yet proven in the market and boasted advanced concepts and radically short time-to-market promises. Over 2 million people would be affected by this migration, so there was no room for error. Think of the project as
replacing all four wheels of your car as well as overhauling the engine whilst the car is still in motion: a seamless transition from one operating system to another, a new user interface with all user's recordings & preferences restored. To the user, the migration would be unnoticeable apart from an upgraded UI. There was an additional requirement that roll-back to the previous Middleware must also work in the event of disaster recovery. (Suffice to say, the project was a success and no roll-back was required).
The stakes were high on both the operator-side and vendor-side, as it posed a significant business risk to the Operator; and a massive reputation-risk on the vendor. Both Operator & Vendor worked very closely together, with complete transparency. It was well noted during the early stages of the project, that significant effort and investment in processes and tools were required from the start. There was also significant investment in effort upfront for resolving the end-to-end architecture and detailed planning (based on Agile principles, it was a massive departure from the classic texts on Agile).
Both vendor and operator recognised the drive for better quality, the project's contract included the following goals for defects to be measured at each output stage of the project:
- Zero Showstoppers per Component
- No more than 3 Major Defects per Component
- No more than 10 Minor Defects per Component
The above criteria was imposed on just the STB system alone. Recall the STB is a system that largely consists of a User Interface (EPG), a Middleware (The Operating System of the STB) & Platform Drivers. The defect criteria was applicable to those STB sub-systems right down to individual component level. Take for example, the Middleware-subsystem: The Middleware system was componentized, broken down into more than seventy components - each component was owned by a component team. Each component had to be tracked subject to terms of discreet quality deliverable - metrics were mined on a continuous basis and trends reported as part of the Defect & Quality Management process. The same diligence was equally applied to Headend & Backend components.
The Operator went further, imposing the following on each component, read below as
Each Component:
- Must have a Component Requirements Specification Document
- Each component requirement must map into a high level Product Use Case
- Must be testable
- Requirements-to-test-mapping matrix document
- Automatic component unit tests must cover component requirements
- 100% Test coverage of Requirements-to-tests
- Must be testable in isolation - component unit test
- Must be testable in a group - component group testing
- Must be testable as a subsystem - Middleware tests
- Must be testable as a system - full stack system tests
- Test results be attached to release notes per release
- Must have no Regressions - 100% Component Tests Must Pass
- Must have an up-to-date API Interface Control Document
- APIs must be testable and map to a component requirement
- Higher level APIs must map to high level product use cases
- Must have a Component Design Specification Document
- Must have an Open Source Scan Summary Report
- Must have Zero Compiler Warnings
- Must have Zero MISRA Warnings
- Must exercise API coverage 100%
- Must test Source Code Branch Coverage, results at least 65%
- Must test Source Code Line Coverage, results at least 65%
With this degree of focus on quality which outlines in clear terms the expectations of the delivery, the vendors no doubt had to invest significant time, effort, and energy in installing quality management processes early on during the project. The Operator has taken sufficient precautionary measures to ensure quality deliverables from its suppliers, so overall tracking quality became a natural part of the programme management process.
As we were on the receiving end of this quality expectation and had to ensure our deliveries met expectations, our project team was partitioned such that Quality & Defects were managed by extending the project team. We employed a quality evangelist, a seasoned technical expert that focused on the software quality deliverable. A project manager was used at key points in the project to focus specifically on managing the defect backlog. A project administrator provided support to the project team in the areas of data mining and management, managing the internal defect processes (ensuring defect tracking tool was used correctly, information was correctly applied, etc.), and generating weekly defect metrics reports that was presented weekly to the customer (Operator). The defect metrics was one way of measuring the completeness and maturity of the project, apart from being software development complete. We had to report on every single deviation from the agreed criteria, trying to satisfy the customer's (Operator's) every demand.
To give you an idea of the amount of tracking, administration and management involved in just ensuring we met the quality criteria, you can view a sample template of the
tracking spreadsheet here - see picture below:
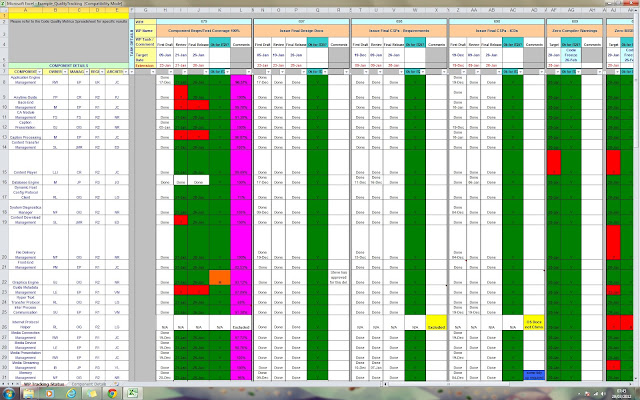 |
| Sample Tracking Tool (A lot of Project Management Effort) |
It's been genericized for privacy reasons, but it gives you an overview of the complexity of just this one Middleware sub-system alone. We had do this for key milestones, typical milestones for a STB project are: Zapper complete, Basic PVR, Advanced PVR, Progressive Download, Interactive Applications (Not sequential activities). Just so you appreciate the context: This Middleware consisted of 80-100 components during the life-cycle of the project, spread across 3 continents, 4 countries, with a development team of 200 people. At the project's peak, there were around 350 people directly involved in the STB development activity, supported by a project team of 20-30 people also geographically dispersed. My part as development owner was overall management of the development backlog. planning, issues and delivery, working through regional project interfaces...
In the remaining sections of this post, I'll attempt to describe what I've come to learn & consider as good practices for Quality/Defect Management to ensuring a successful outcome for most DTV STB projects (based solely on past project experiences).
In a typical STB project, there are usually more than one vendor involved. As vendors, it is in their best interests to support multiple customer projects at the same time, generally building upon a common software platform. These vendors can be viewed as traditional software vendors. The following players are involved: Chipset Manufacturer, STB Manufacturer, Middleware Vendor, Virtual Machine Provider, Application Vendor and Systems Integrator (SI). The SI of course doesn't own any software components, but is primarily responsible for pulling the components together to provide a coherent STB build. Each of the vendors will have its own internal processes to manage quality. They will also have their own internal defect tracking tool, with its own terminology that is well understood. Some of these vendors operate quite independently, but when the STB stack is pulled together, it often involves collaboration between multiple parties (as facilitated by SI) in resolving issues.
Because there is no internationally accepted standard for defining defects, and taking the disparity between vendors into account, it becomes necessary for the DTV project team to ensure there is consistency in terminology across all parties. For example: A Showstopper means what it is, and nothing else; a Priority P0 is assigned by one authority only and no one else, etc.
Imposing common terminology upfront sets the stage for the programme, ensures consistency, avoids unnecessary noise (which wastes time) and promotes a common understanding and set of values across the board. With a clearly defined criteria, teams can use the template as a handy look-up, it also empowers people to challenge certain defects, and is an enabler for everyone on the project to raise and classify defects with reasonable consistency.
The most important feature however is consistent representation. All vendors must understand the project's objectives and make the necessary adjustments to their internal defect tools. When reporting defect metrics for the entire project, there is thus some confidence in the integrity of the data.
There is often confusion around Defect Severity versus Priority. Priority calls are often subjective and usually at the discretion of the Product Owner or Delivery Manager accountable for delivery. Severity on the other hand, can be more accurately defined, and can take advantage of a useful look-up table. This helps developers, tests, integrators and managers alike, in setting severity consistently.
In most of the past projects I've worked on, there are usually the following defect Severity definitions: Showstopper, Major, Minor. In terms of Priority, some projects use separate Priority defines: P0, P1, P2; whilst others imply priority by the overloading the Defect severity, i.e. a Showstopper by definition is assumed priority P0. As the project matures, the Product Owner/Delivery Manager gets more involved in defining the priorities, which may contradict the look-up definitions. At launch stage, this is solely at the discretion of the senior stakeholder accountable for Launch.
Nevertheless, I strongly support the argument for consistency and common language. I have over time collected some useful tools for managing DTV projects, one tool is a useful Severity & Priority Matrix template:
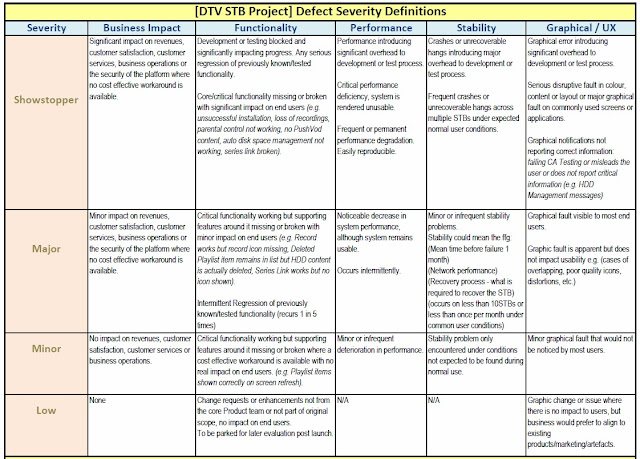 |
| Defect Severity Template |
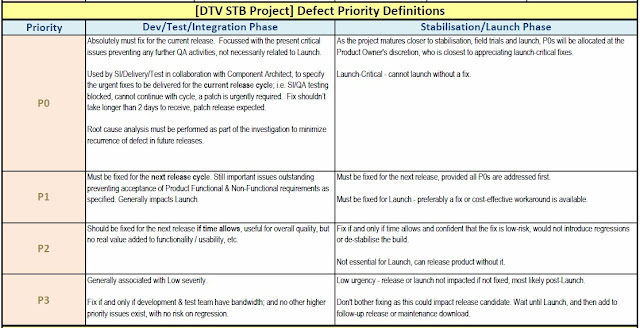 |
| Defect Priorities Template |
Download the Excel Template
Download the PDF Template
Recall a previous post that discussed
auditing your project's processes. In a recent audit carried out on a project I wasn't primarily involved in, the recommendations around defect management, from the auditor
S3, echoed much of the above templates that I'd already instigated in my project, prior to the audit exercise.
There was an additional recommendation of the option of Service Level Agreements in terms of response times for defect resolution that must be agreed with your various suppliers:
- P0: Acknowledgement within 1 hour, Initial Response within 24 hours, Fix/Workaround within 48 hours
- P1: Acknowledgement within 1 hour, Initial Response within 2 Working Days, Fix/Workaround in next release or within 1 month whichever is earlier
- P2: Acknowledgement within 1 hour, Initial Response within 5 Working Days, Fix/Workaround before final release according to agreed schedule
You can also reduce the work on defect administration by architects (as the programme depends on architects assessing the severity of defects) by providing guidelines for priorities, for example the following are generally used for STB projects:
- STB SI Stability Showstoppers
- STB SI Smoke/Soak Test Regressions
- Customer Sanity Regressions
- Customer Acceptance Tests Showstoppers
- Existing Showstoppers (oldest first)
- Component Stability Showstooppers
- Showstopper Feature defects
- Major Defects
- Features broken by Major defects
I've used variations of the above in past projects, I am currently using this in my present project. It works - but it requires some administration and consistent diligence!
Earlier I recounted some of the quality criteria that was imposed in a past project. Some might say that was quite a heavy-handed project; given the context and expectation, I would say the expectation was not that unreasonable, if not I think it was missing a few quality targets (such as Code Complexity, Cyclomatic Complexity, Function Points, Defects per Lines of Code, Defects per Functions, Defects per Region).
Not all projects need to define quality criteria down to that level of detail, it essentially depends on the nature of the project. Other factors include the maturity of your component suppliers. If your suppliers have earned a reputation for quality and have audit results to prove, perhaps they're a
CMM level 3/4/5 company, or
ISO9001 certified then that would naturally instill some confidence in assuming quality deliverables. Another factor related to component vendors is maturity in the marketplace - if your project includes mature, proven components that have a well-known track-record, the it's relatively unlikely that things will go pear-shaped. However, if you're dealing with the somewhat unknown, unclear, where the level of uncertainty and risks are quite high, then you cannot ignore quality criteria. You should have some way of defining your quality objectives for the programme. At the very least, you should set the expectations of quality building upon best practices, and should go to the extent of auditing your supplier's processes to increase the chances of your project's success.
Settling on a common terminology for defects as described above is the first step towards specifying clear, measurable, specific and timely quality criteria. You could go down the Software Quality metrics route as discussed above if you are serious about your software.
Realistically however, if you're an Operator, your end result is defining the success criteria for the project delivery. Generally, no matter what development methodologies your component vendors adopt, or the integration strategy you define in terms of continuous integration & continuous delivery -- it is natural to approach STB projects using clearly defined stages, or in project management terms: Stage Gates. At a high level, the stages represent feature completeness of the product:
Zapper > Basic PVR > Advanced PVR > Push VOD > IP VOD > PDL > Interactive Games > Launch.
In order to reach the Launch milestone, there are a few testing/stabilisation gates that need to be passed. This is where the Common Defect Severity & Priority definitions and Delivery Milestones go hand-in-hand (most of the below concepts were used in the project I mentioned previously):
- Milestone: Start Closed User Group (CUG) Field Trials
- Criteria: All Components Must be Functionally Complete:
- Verified acceptable by component tests, system testing, and pre-field trial testing
- Zero Showstopper defects from frequent use (e.g. normal end user, installer or customer-care user day-to-day usage) of product functionality in Functionality, Performance or Stability.
- Product to be stable in normal end user, installer, customer-care user usage, such that it can continuously run without rebooting for >72 hours at a time.
- Less than 5 Major defects per functional area in Functionality, Performance and Stability
- Any Showstopper graphical bugs by exception.
- Milestone: Start Wider Field Trials
- Criteria: CUG Ends, Release Candidate build is available
- All product functionality available with Zero Showstopper defects in any area.
- Product to be stable in normal usage, such that in can continuously run without rebooting for > 1 week at a time.
- Less than 20 Major defects across Functional, Stability & Performance in all Functional areas - across the entire product.
- All such defects to have clearly identified and agreed action plans associated with them and a forecast resolution of < 3 weeks.
- Zero Showstopper defects.
- Major graphical defects by exception.
- Milestone: Launch - Go Live!
- Criteria: Field Trial Exits, Launch Build available
- Zero Showstoppers or Zero Critical issues whatsoever - any defect affecting revenue classified deemed as critical.
- A level of minor defects that have no negative impact on customer satisfaction, which does not represent a regression of what is in the field already.
- Stability issues must be sufficiently rare as not to be expected to be encountered under conditions found in normal end user, installer or customer-care user usage.
- Product should not crash or need to be rebooted.
- Graphical and Performance issues should be of a nature such that they are not noticeable to most users using the box in normal end user conditions, installer or customer-care usage patterns.
- Both above to be established through field trial surveys, with 95% of respondents confirming the software to be equal to or better than current infield software in terms of stability and performance.
In addition to the above set of criteria, it is also quite useful to breakdown the STB product into the key functional areas to track the impact of defects. By breaking down the product into functional areas, and tracking the spread of defects across these areas, the programme can gauge the overall health of the product. The product owner is best placed to prioritise the areas to breakdown, but STB products are quite constrained and already have a well known feature set. For instance, the following breakdown can be used:
- User Experience / Usability
- Finding Content via Service Information
- Finding Content via On-Demand
- Live TV Viewing
- Booking Recordings and Reminders
- Broadcast Recording - Schedule and Current
- PushVOD
- On-Demand Downloading
- Purchasing Content
- Parental Control & PIN Management
- Using the Planner / Playlist Management
- Live TV Trick Modes
- Playback Trick Modes
- Managing Resources (Tuner Conflicts)
- Interactive Applications
- Usage Monitoring
- System Operations
- Diagnostics / Health Check
- CA Callback
- Internet Connectivity / Browsing
For each of the above functional areas, you can define more targeted quality criteria. This helps the project team direct focus and attention intelligently, working towards clear, specific, measurable and timely objectives. The functional areas gain increasing focus as you approach launch, and it is generally within this phase of the project that we then start making launch-critical decision, concessions and waivers. So understanding the critical criteria for business decisions is helpful.
DTV projects are becoming increasingly more complicated. Traditional Operators are taking risks and doing more enhancements than perhaps five years ago, where the broadcast system was fairly stable, and all major enhancements were more STB-centric than headend. With features like PushVOD, IP-VOD, Progressive Download, Recommendations, Audience Measurement for Dynamic Advertising and Recommendations -- these are big-impact features that touch the entire value-chain: STB, Headend, Backend, Infrastructure components are all impacted. Overall your programme needs to track progress for the entire value chain, and quality needs to be managed effectively.
This largely becomes the responsibility of the Systems Integrator (SI) assigned to your programme, from an Operator's perspective. For an individual product vendor's perspective, you need to align your existing internal processes to match the requirements and expectations of the programme you're delivering to.
Having a clear Defect Management Policy that not only defines what Defect Severities & Priorities as described above, but also describes the processes for raising defects, assigning to component owners, required information, etc. This document must be published and distributed to all vendors in the programme.
It is quite obvious from an SI perspective why you need to define a clear Defect Process and Workflows, but if you're a vendor delivery Middleware or UI, with your own established tools and processes, you might question the need for creating a separate process for a project in the first place. Generally the reasons behind this are the following:
- In some customer projects, general product processes will not apply. There will be mismatch between internal definitions versus customer expectations
- Defects will be raised internally by your own development/test teams, as well as by the customer and system integrator. Your team need to understand where different defects come from, and priorities
- Customers generally will use a different defect tracking system to manage all their supplier deliverables. For example, S3's Engage Portal is increasingly being used as the central hub for release and defect management, whilst vendors may choose to use Rational Clearquest, BugZilla, Spira, Jira or TFS. Your team needs to understand the mechanics around this: how does the customer and vendor ensure the trackers are synchronised?? This generally requires a custom process or tool.
- In terms of integration, release and branch management - as a vendor you will be supporting different branches of your product. Your product team need to understand what the policy is for fixing defects on your main product trunk versus customer branches - a customer might be given higher priority than your product development, this process needs to be made clear to your development/test team. Do all your component teams understand how to manage defect fixes across multiple branches??
- Quality of the release is measured according to the number of defects open - defect metrics are important to the customer. Your processes will have to change to support the metrics needs of the customer, your teams need to learn about maintaining accuracy of data, hence a clear defect process is required.
If you have never created a Defect Process/Policy document before, here are a handful of questions to guide you along:
- Why do you need a separate Project Defect Process anyway?
- Can you take me through a simple for work flow of a defect in in my project?
- Who can raise defects in my project?
- What is the project's definitions for severity?
- How does the project define defect priorities?
- Are there any tools being used outside of our internal defect tracking tool?
- What should you do if your defect is lacking in detail and you need to find more info?
- Who is allowed to postpone a defect?
- Who is allowed to reject a defect?
- Who is allowed to close a defect?
- Who is allowed to duplicate a defect?
- Who is allowed to clone a defect?
- Who is allowed to move a defect to another component?
- Who is allowed to open enhancement requests?
- Who should test and verify a defect is fixed - i.e. where is the ownership?
- How do we handle defects from an external tracking system not our own?
- How do we handle multiple projects for the same customer?
- What do you do when you find a defect that is common to multiple customers?
- What do you do when you find a defect on one customer branch that is relevant for another customer branch?
- What is the priority for fixing defects on customer branches?
- What do you do if you moved forward in your sprint but the customer requires an urgent fix?
- How to use your defect tracking tool - mandatory fields, information required, requirements for log files, etc.?
If everyone in your project can answer all of the above without needing it documented, then great - but I can guarantee you that there's bound to be confusion and ambiguity in this area - that's why the programme management team should dedicate time and energy to bed these processes down. It will help your operation in the long run!
Ensure consistency of data
Earlier I mentioned the disparity of bug tracking systems that maybe in use by different vendors (if you're the customer) or by your customer (if you're a vendor delivering to a customer). Additionally the System Integrator assigned might opt to use a completely different system as well.
Just take a look at what the market has to offer:
comparison of different defect tracking tools. There is no perfect tool that will meet all your needs, typically these tools provide enough of a foundation for best practices, it becomes complicated as the reporting needs for the project matures, eventually resorting to custom scripts and tools that sit on-top the defect tool to provide the information in the format and view you need. I've got a deep background for
IBM Rational Clearquest as I've used that tool for almost my whole career to date, which makes me pretty biased to the Rational Development/Quality philosophy. Yes, that tool can be pretty heavy handed, requires a lot of administration, and depending on the size of your organisation and maturity of products, the centralised versus distributed deployment models can be somewhat of a pain. Nevertheless, with an accessible API, one can create reports and dashboards relatively easily; automation tools integrate well too. Coupled with
Rational ClearCase, you then have quite a solid tool for your software management policy. I have used other lightweight tools like
BugZilla,
Redmine &
Roundup -- but I found those to be pretty much featherweight contenders not fit for the heavyweight requirements for a serious DTV Programme.
In my current project we have a System Integrator using
Spira, one Application development team using Spira as well, another team using
Pivotal, a team using
Jira, one vendor using
TFS, and another vendor using
IMS.
So the challenge then is how do we maintain consistency of data? We cannot force our vendors to change tools, but what we have to ensure is that the mappings of defects reflect the common terminology as noted previously. That's the first point: ensure all tools comply with the project's definitions for different types of defects.
The next challenge is ensuring data synchronicity. As a vendor, how do you ensure that defects raised by SI find their way back to your internal defect tracking system? As a customer or SI, how do you ensure that your vendors are not hiding crucial defects in their internal tracking systems that should be exposed to the customer?
Maintaining consistent data is key to enabling more accurate production of defect metrics. It also allows the project to have a unified view of the end-to-end system, confident that all parties are using the same terminology that is reflective in the data being reported. A critical phase of reaching the Launch stage of a DTV project is a period of focused defect resolution and fixing. Based on the rate of defects being submitted and fixed, we can use this information to better predict the closure of the project. Ensuring consistency of data also prevents us from not seeing the true picture - the classic
tip of the iceberg scenario: the customer/SI might have just a shallow view of the true defects status, there maybe hidden defects your vendors are not publishing that could influence the outcome of the project.
S3 have developed a portal, called
Engage, intended to better manage the system integration and global management of an operator's delivery. It is more than just an issue tracking system, offering a repository for documents (not a document management system) as well as a release repository (instead of having separate FTP sites floating around).
In the example past project I mentioned earlier, Engage was the primary tool being used by the customer to manage all their suppliers. We started off by providing just the Middleware sub-system but later also provided the EPG, and then also took over system integration. During the early days of my managing the Middleware, we realised there was a disaster brewing because of the mismatch between Engage and Clearquest, the customer kept asking about issues we weren't really focusing on. We did have one person assigned to tracking Engage but it was not a full time activity, the process was manual and quite tedious and error-prone (manual copy-and-paste) from one system to another. This clearly wasn't efficient. We introduced automatic importing from Engage-to-Clearquest, and also exported from Clearquest-back-to-Engage, ensuring that both Clearquest-and-Engage were in sync. Being on the same page with the customer makes a whole lot of difference!
Take a look at a typical workflow required to maintain synchronicity - this is based on how we solved the Engage-Clearquest problem (genericized for privacy reasons) for our Middleware component (
PDF,
Visio):
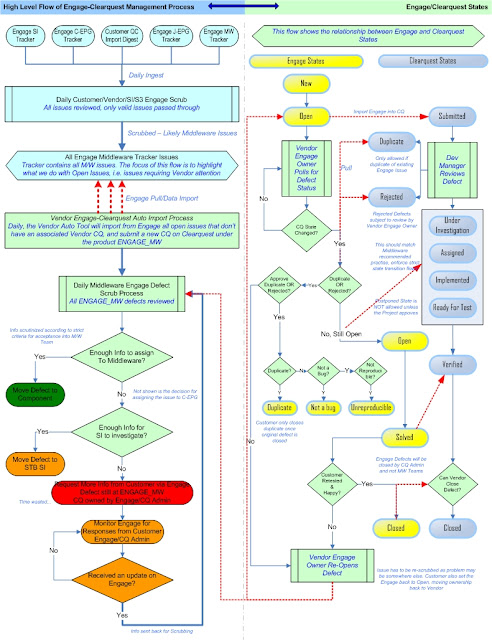 |
| Syncing Engage-Clearquest Workflow |
Because the Middleware is a fundamental component to a STB-stack, offering services to many consumers, defects will arrive from various sources. The Engage portal was used to track the other component vendors, typically the EPG developers, SI & Test teams. Every day the customer would raise issues on the Engage Middleware tracker, as well as the other trackers (SI, xEPG, ATP). Issues arrive on the Engage tracker after an internal review process by the customer. We enforced a daily defect scrub/review process, involving our lead architect, component technical leads, customer test analyst lead, customer system integration lead, and technical project managers. Everyday at 10AM, the newly submitted defects would undergo a review "Scrubs". For each issue that was assigned to our Middleware tracker, the customer had to ensure sufficient detail was captured in the description to allow us to start our investigations. We created a custom tool that ran every night like clockwork, at 19:00PM, imports all new Engage issues automatically raising new Clearquest defects (CQs). The tool enforced strict rules according to the status of the Engage item, one rule was that only those Engage items assigned to us (a.k.a. Vendor Owner) will generate a new vendor CQ, assigned to a generic owner called ENGAGE_MW for Middleware issues. There were cases where old Engage items were re-opened, and a new CQ would've been auto-generated, even though the previously assigned CQ was still in the Open State & assigned. Every morning, the scrub would agree to accept an issue as requiring further investigation in the Middleware , and will move the CQ from ENGAGE_MW to the respective Middleware component as assigned by the scrub for initial investigation, we'd add comments like "This defect was reviewed in the daily scrub call and we think component XYZ is best placed to start the investigation" or "There is insufficient information to assign to a component, this needs to be triaged further by STB SI".
To maintain consistency of data, we had to ensure that the states for Clearquest defects were mapped to the states in Engage. The customer generated reports from Engage, which cross-referenced our internal CQs from Clearquest. We maintained Clearquest reports which was also communicated back to the customer in the form of weekly Defect Metrics reporting. Hence the need for specifically defining a workflow that established mappings between the different defect tracking tools for maintaining consistency of data.
I am quite certain this problem will creep up on almost every major STB project, so hopefully I've given you an idea of the work involved. We had a project administrator involved full time to the activity of ensuring the defect tracking systems were synchronised, that information was accurate and that information integrity was maintained. This same administrator also ensure that the Showstopper/Major/Minor was equally mapped to the Critical/Major/Low translations of the different tools. More importantly, when there were discrepancies in the metrics reporting, we would go to this project administrator as the first port of call for clarification.
Defect Metrics is not just y
et-another-administrative-task-by-project-management-to-keep-themselves-busy-and-create-annoyance for development teams. Defect metrics is not about just reporting defect counts using visually appealing graphs and figures again, to keep senior management happy. Defect metrics is also not an an over-the-top management intervention that goes against Agile Development philosophy.
Defect metrics provides valuable information relating to the health of the overall project. It can provide useful insight into problematic areas, highlighting areas of bottlenecks, identify areas for improvement -- all useful pieces of information for the project management team to make informed decisions, taking corrective action.
Applied correctly, defect metrics can be an invaluable tool providing input into the discussions around a project's success criteria and probability for launch. Recall the earlier delivery milestone criteria for a STB project launch: Functionally Complete, Start of Closed-User-Group Trials, Start of Field Trials to Final Launch. To reach each one of these milestones, your project needs to progressively improve the quality of the defects and stability of the system. Without useful metrics to hand that can be used to highlight the current trend of defects in your system, versus a projected view (extrapolating trends from previous performance) of likelihood of actual project completion -- you have no scientific or factual basis to justify confidence in reaching your milestone deliverables, apart from your hunch-base.
This is just not my opinion - there is a vast body of knowledge around the subject of Software Quality Measurement (some supporting evidence will be presented now, followed by a real-world example):
A DTV project is a naturally software-intensive system, and as such, a key measurement of software systems is the latent state of bugs or defects. Taking a few words out of Steve McConnell's
Software Project Survival Guide: How to be Sure Your First Important Project isn't Your Last (Pro -- Best Practices)
(Chapter 16 on Software Release):
At the most basic level, defect counts give you a quantitative handle on how much work the project team has to do before it can release the software. By comparing the number of defects resolved each week, you can determine how close the project is to completion. If the number of new defects in a particular week exceeds the number of defects resolved that week, the project still has miles to go...
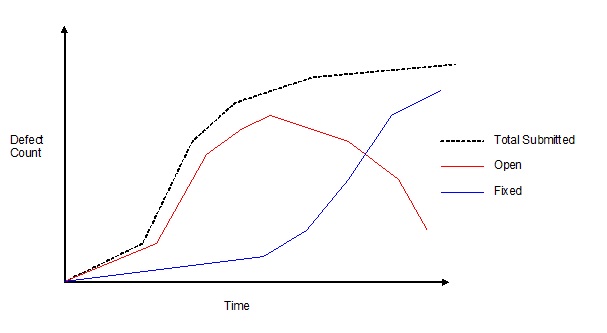 |
| Generic Open VS Closed Defect Trend (Shows ideal - fixed overtakes open, project in good shape) |
If the project’s quality level is under control and the project is making progress toward completion, the number of open defects should generally trend downward after the middle of the project, and then remain low. The point at which the “fixed” defects line crosses the “open” defects line is psychologically significant because it indicates that defects are being corrected faster than they are being found. If the project’s quality level is out of control and the project is thrashing (not making any real progress toward completion), you might see a steadily increasing number of open defects. This suggests that steps need to be taken to improve the quality of the existing designs and code before adding more new functionality…
According to the Software Engineering Book of Knowledge (
SWEBOK Chapter 11 on Quality), this is what they have to say about metrics and measurement:
The models of software product quality often include measures to determine the degree of each quality characteristic attained by the product. If they are selected properly, measures can support software quality (among other aspects of the software life cycle processes) in multiple ways. They can help in the management decision-making process. They can find problematic areas and bottlenecks in the software process; and they can help the software engineers assess the quality of their work for SQA purposes and for longer-term process quality improvement... Finally, the SQM reports themselves provide valuable information not only on these processes, but also on how all the software life cycle processes can be improved...While the measures for quality characteristics and product features may be useful in themselves (for example, the number of defective requirements or the proportion of defective requirements), mathematical and graphical techniques can be applied to aid in the interpretation of the measures. These fit into the following categories:
Statistically based (for example, Pareto analysis, runcharts, scatter plots, normal distribution); Statistical tests (for example, the binomial test, chi-squared test); Trend analysis & Prediction (for example, reliability models).
The statistically based techniques and tests often provide a snapshot of the more troublesome areas of the software product under examination. The resulting charts and graphs are visualization aids which the decision-makers can use to focus resources where they appear most needed. Results from trend analysis may indicate that a schedule has not been respected, such as in testing, or that certain classes of faults will become more intense unless some corrective action is taken in development. The predictive techniques assist in planning test time and in predicting failure....They also aid in understanding the trends and how well detection techniques are working, and how well the development and maintenance processes are progressing. Measurement of test coverage helps to estimate how much test effort remains to be done, and to predict possible remaining defects. From these measurement methods, defect profiles can be developed for a specific application domain. Then, for the next software system within that organisation, the profiles can be used to guide the SQM processes, that is, to expend the effort where the problems are most likely to occur. Similarly, benchmarks, or defect counts typical of that domain, may serve as one aid in determining when the product is ready for delivery.
And last, but not least, there is actually a website dedicated to the Defect Management process:
www.defectmanagement.com which basically says much of the same as above in more palatable English:
Information collected during the defect management process has a number of purposes:
To report on the status of individual defects.
To provide tactical information and metrics to help project management make more informed decisions -- e.g., redesign of error prone modules, the need for more testing, etc.
To provide strategic information and metrics to senior management -- defect trends, problem systems, etc.
To provide insight into areas where the process could be improved to either prevent defects or minimize their impact.
To provide insight into the likelihood that target dates and cost estimates will be achieved.
Management reporting is a necessary and critically important aspect of the defect management process, but it is also important to avoid overkill and ensure that the reports that are produced have a purpose and advance the defect management process.
Real-world examples of Metrics Reporting
Drawing again from the example project, as highlighted in the beginning, there were clear milestone deliveries communicated at the project's initiation. We had to start measuring our defects status early on in the project, despite having not reached functionally complete status. Some people are of the opinion that defect metrics should only start once development phase is fairly mature and we're into our integration & test / stability phase, as doing this any earlier would cause undue noise to the development teams, and unnecessary management administration. Whilst others take the view that defects should be monitored early, from the development phase, right through the end. I share the latter view, as I believe that early monitoring of defects during the development phase is bound to highlight problematic areas in requirements, design, architecture and coding, that if left unresolved until much later in the project would be a costly exercise. I also believe that continuous integration and testing early, surfaces defects earlier than later.
Going back to the example project, we had to supply our customer with weekly defect metrics reports. We also had to extrapolate past trends in predicting the future outlook. We were also then measured and tracked on our predictions and were taken to task if we were woefully out with our predictions! I was not the one producing the reports to the customer, that was handled by the delivery team -- however my middleware component was the major supplier to the programme, so I took it upon myself to maintain my own internal view of the metrics. This was a contentious issue at first because there were discrepancies with what was being reported to the customer, versus my own internal calculations. This actually struck a chord with the senior account holder, who based his method of metrics from sound judgement and experience, whereas I wanted to be more academic -- suffice to say, I did eventually come around to the
senior manager's way of thinking, I've come to respect his hunch-base, wisdom earned from a great track
record of delivering successful projects in the past (he's an inspiration to many!). I have also come to appreciate that if you've delivered projects before, that is valuable experience, that based on your instinct alone, without requiring a detailed plan, you can fairly accurately predict when or how long a project would take. I had a recent experience where I had to stand my ground based on my own experiences and learning to base my own project's outcome of success solely on my past experience, or hunch-base. The term
hunch-base is from Tom Demarco's novel
The Deadline : A Novel About Project Management
which every Software Manager should read by the way...
Manager's crude way
We relied on a very basic approach (not overkill) to defect prediction. The metrics were based solely on defect counts alone, using a history dating back to the previous four weeks. The number of Open/Closed defects was based on a rolling four-week period, based on the number of defects closed in this four-week period, predicted the future that showed the number of days remaining to fix all open defects. Using the milestone criteria, the defect metrics report tried to establish predictions around those dates.
My own internal metrics predictions
There are more deeper analysis and statistical techniques to mine data and make defect predictions, even down to using a mathematical model. I did not go down that route, even though I was really tempted to do so. Instead, I went a step further than the crude approach and based my predictions on the trends of submitted versus closed rate for all defects, with a focus on Showstoppers & Majors. Taking into account not only the defects closed in the last week, but also those submitted, if you mine enough data you can then rely on a statistical average for open/closure rates to predict when the project or component is bound to start the downward trend to reaching zero.
I went to the extent of creating a model in Excel that basically played with two variables: Submit Rate vs Closure Rate. To get to launch, and to get to the ideal that your closure rate must surpass the submit rate, the following could happen: Assume your submit rate decreases over time and/or your closure rate increases over time. The chances of your submission rate decreasing over time is much higher than your closure rate increasing over time. Why?? Because over time we have to assume that the quality of the system is increasing over time and that testing will find less and less defects. It is unrealistic to assume your closure rate is going to continuously increase over time because once you've established your teams capability for closing defects, i.e. their maximum throughput, closing a Showstopper/Major defect will take as long as it takes. It is unlikely your team size is going to continuously change or that your team will be exceeding expectations. Generally as we reach the launch phase, the teams will have been working at full throttle, getting any more performance gain out of them is going to be a tall order. Hence it is best the closure rate is assumed constant, and hope for a decline in submission rate over time. The model was still crude in that it assumed a uniform reduction in submission rates -- nevertheless it was still a model that could be used to output a prediction based on some assumptions. Looking back however, the model did come pretty close to reflecting the eventual end-date. The snippet below shows the front page of the tool: It can be used to track separate components or the Middleware as a whole. In the figure below, it shows the status & prediction for reaching the launch milestone for the entire Middleware component. It also showed the current trend at the time that the Middleware component was looking in good shape as we started to see at last that we're closing more defects than were being submitted:
Some example metrics I like to report in my projects
Defects Dashboard Summary:
- Total Open
- Submitted
- Under Investigation
- Implemented
- Ready for Test
- Verified
- Total Closed
Age of open defects:
- By age, calculate the duration the defect has been open (from submit date to present date), along with the owner, and the state of the defect (submitted, assigned, etc.)
- Also include views on severity & priorities
Trends:
- Week by Week view (ability to generate a table if needed) preferably a graphical view of the following:
- Total Open trend (delta between current week & previous)
- Total Closed (deltas)
- Submission rate VERSUS Closure Rate
- This graph is helpful as it’ll show you if the project is trashing or not. When you ready for launch, the trend should clearly show Closure rate consistently higher than submit rate
- The data must be readily available, because it’ll help you predict the defect rate leading up to launch. We should be able to predict, based on past history of defects submit/close rate, the likelihood of reaching a stable build
View of defects by Feature:
- A Pie-chart giving us the breakdown of defects by feature / user story. This will show us how complete we are functionally
- This depends on whether there are appropriate fields being used in your defect tool to track these
- Feature priority must also be taken into account – probably a separate pie chart. This will show you which areas to concentrate on
View of defects by submitter: Need a way of checking where the defects coming from:
- UI developers
- UI Testers
- SI Integrators
- SI-QA Testers
- Customer ATP
- Field Trials
Time it takes to close defects:
- You need to answer: How long does it take to close a Showstopper/Major P0/P1/P2 on average?
For the SI projects:
- View defects by Component: Drivers, Middleware, UI
- For each component, apply the same metrics as above (Age/Trend of Submit versus Close, etc)
Measuring development schedule also contributes to overall metrics and is related to overall Defect Metrics reporting
There is usually a development phase for one major component of the STB project, could be a Middleware component or the EPG Application / UI. The completion of the development phase will obviously impact the project's launch criteria, it is therefore a natural requirement to track development as part of the overall metrics reporting. What these metrics will focus on is not only the defects resulting from development, but the productivity of the team itself.
In the example project, we had to track and report on our Middleware current status against planned schedule, and include predictions of time to completion, including a prediction of the likely defects to encounter at the end of the development phase; followed by a trajectory or glide-path for time to completion of defects.
The following topics can be considered useful reflection points for metrics regardless of the software component or development methodology (assumes Agile):
- What is the feature breakdown?
- How many features development complete?
- How many user stories implemented with no outstanding bugs?
- How many user stories implemented with outstanding bugs?
- How many user stories to be planned?
- How many user stories blocked?
- What is the prediction for completing a feature?
- Predictions for completing remaining features?
- Measuring Sprint Progress in more detail:
- Planned versus Actuals being reported for each user story
- How many stories completed on time – development, tested with no bugs??
- How many stories missed the planned completion date but still delivered within the sprint?
- How many stories missed the sprint completely, despite not being blocked by any dependencies?
- How many stories were blocked by unforeseen issues?
- What issues were these?
- How can we take corrective action to prevent blocks from happening again?
- Measuring Risk-Mitigation stories:
- How many risk mitigation stories are on the backlog?
- When is it predicted to close down these risk mitigation stories?
- What are the consequent stories dependent on the outcome of risk mitigation stories?
- Adding Other stories to Sprint Backlog:
- STB SI will be influencing the objectives of the sprint – SI will provide a list of defects that must be fixed for the next release. This needs to show up as a story
- Defect fixes must also be allocated a story – accounts for time
- Overall burndown of Component completion estimations
- Given the following things can happen during a sprint:
- Developing new features
- Risk mitigating features for future sprints
- Fixing of defects raised by dev testers / developers
- Resolving SI objectives
- Supporting release process
- Pre-planning
- Can we quantify more clearly, even though it's an estimate – of the likely burndown trend to result if everything is accommodated for – where does the end date come out??
Other Useful Example Metrics
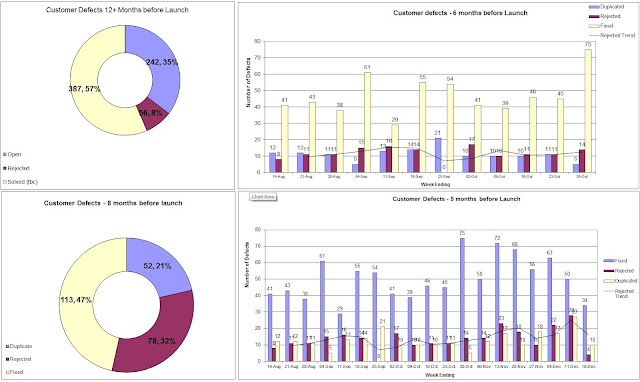
The
picture below illustrates a snapshot in time of how we used metrics reporting over the life-cycle of the example project. This should give you some idea of what it involves:
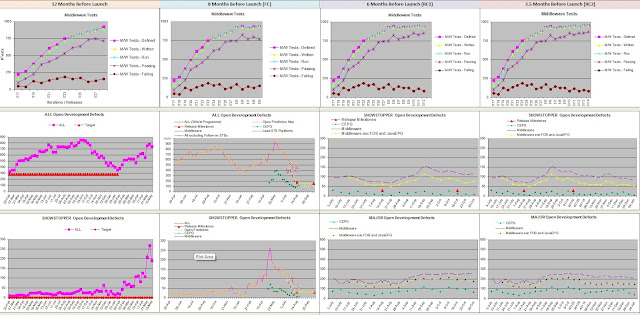 |
| Tracking Metrics through different phases of a project (12 months to Launch) |
The first row in the above dashboard tracked the Middleware test coverage in terms of total test cases defined. written, run, passing & failing. The point of those curves is to illustrate the gaps between the various areas:
- a gap between defined and written test cases highlights the backlog of work remaining to implement the test cases as planned [ideal is to have defined to equal written]
- a gap between written and run indicates the bottleneck with executing test cases (test system was fully automated and required to complete within 48 hours) [ideal: run equal written - all implemented tests must be run];
- a gap between run and passing highlights the quality of the test cases or quality of the Middleware [ideal: all tests run must pass];
- a gap between failing and passing indicates how far the component is away from meeting the quality criteria [ideal: zero failures]
Over time as the project reached its end we had close to 2000 Middleware tests alone, with a pass rate of 95%. We extended the tests to system level testing - basically those Middleware tests that failed but didn't manifest themselves at system level was given low priority.
The second & third rows focused on All Open Defects, Showstopper & Major defect trends, with the aim of highlighting the gaps between reality and planned targets. We also had to predict a "glide-path" to reaching the target, which is what the curves in the second column highlights. These curves were getting incredible complicated to produce based on manual administration, we dropped those prediction curves and focused our efforts on burning down as many Showstoppers/Majors as we could.
In reality, your defect metrics reporting will undergo several iterations before the project settles on what is realistic, simple, understandable, easy to maintain and track. Hence why the senior stakeholder went down the practical route and established predictions based on the performance of the last iteration and predicted the burn-down based on the remaining days to reach the target.
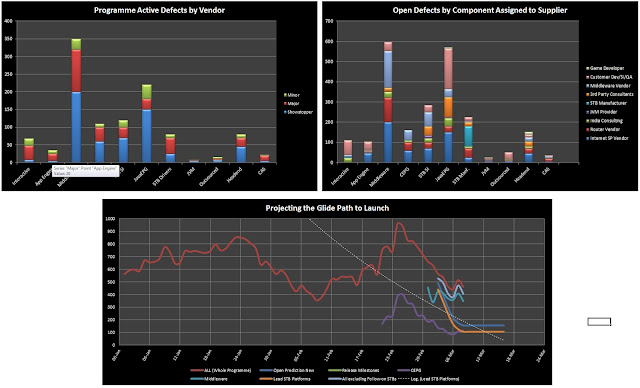
Below is
another example of how to communicate the progress of your software components in reaching the agreed targets:
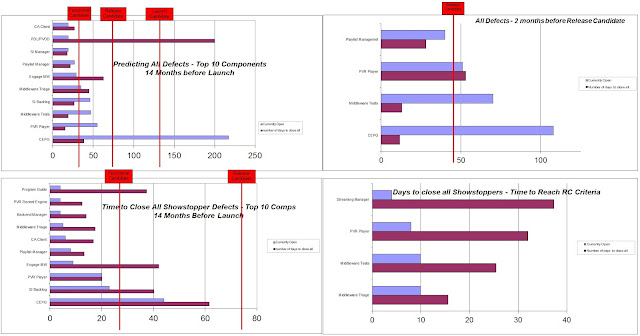 |
| Metrics reporting/predicting time to complete defects to meet Launch Criteria |
In the above picture, we focused on the top components that required attention, currently failing the launch criteria. Management used this information and implemented recovery actions where possible (e.g. beef up the team by using developers from other component teams, focused one roof integration (ORIT) sessions); but in some components like the Streaming Manager, we just had to accept the status as is because it was one of the most complicated components in the Middleware, responsible for all features of media streaming - core group of technical experts very difficult to clone (as evident by the small number of open defects but predicted the longest time to complete).
We also tracked the
classic defect counts of Submitted VS Closed:
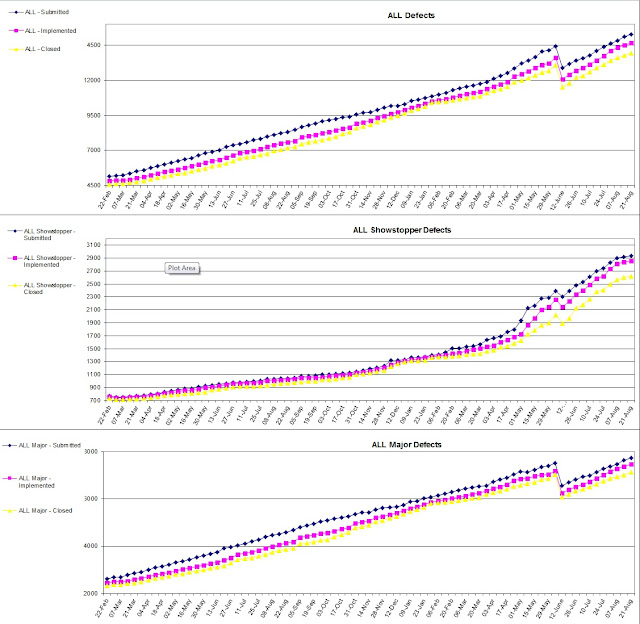 |
| Classic Defect Submit/Open/Closed Trends |
The main focus of these curves, as mentioned above in citing Steve McConnell, is to measure how the project is managing the defect closure rates: essentially, are we in control of our defects? The curve should highlight this quite nicely, the goal being to be as close to the total submit/open line as possible, at best, to be able to close more defects than submitted:
- The implemented curve is the current total of all defects which have been implemented or closed.
- The gap between Implemented and Submitted reflects the amount of development work yet to be done.
- The gap between Implemented and Closed reflects the amount of work to be done by Integration / Test teams for verification.
The trend did highlighted the classic creep in defects during the early stages of the project, although we were continuously developing and integrating / testing at the same time. Eventually though, the trend did match the classic outcome of peak in submissions followed by a decline, then overtaken by the increase in closure rate.
Measuring Rejected and Duplicates
A significant amount of time can be wasted in the areas of development and system integration, investigating issues that turn-out to be non-issues; or investigating defect reports with poor quality information; or also time is wasted investigated problem reports that have been previously been reported on (duplicates). To the project manager this lost time cannot be gained, it's time wasted, and for all intents and purposes you have aim for maximum efficiency, eliminating the waste. Having access to metrics reporting the incidence of Rejected/Duplicate reports is definitely useful in highlighting problem areas, without having to revert to detailed root cause analysis.
Take a look at the
picture below: It is immediately apparent that a high proportion of defects being raised by the customer test teams are rejected or duplicated. At some point in the project, this amounted to more than half the total of customer raised defects. This alerted us to instigate stricter controls over the quality of information being reported, which resulted in us enforcing the daily defect scrubbing process as discussed in the opening sections of this post. Over time the quality of the defect reports did improve and the number of false defects reduced, saving us some valuable developer and integrator time.
 |
| Rejected/Duplicated Trends - Aim is to minimize false defects |
Other Reference Examples
Report Metrics to the Executive Committee
Communicating metrics to the senior executive committee on your project is of crucial importance to ensure that the necessary decision-makers have the correct visibility and understanding of the true status on the ground. Typically you would focus on the high level metrics across the Programme, focusing on specific vendors and trends overall for the Programme. Below are a few samples of interesting metrics that can be digested by the ExCo. Whilst I've not read the complete book myself, I have interacted with many senior management people who highly recommend
The Visual Display of Quantitative Information
; and I've been around many executives who insist on visual information without the detail so much so that I myself have become quite the visualisation guy: pictures convey the message much clearer than having someone try to explain and show you numbers!
Here are some
example metrics I've used in the past that have helped in conveying the message of the programme - The intent should be self-explanatory:
 |
| Defect Metrics Report for Exec Committee |
Implement Root Cause Analysis (RCA)
Again, there is a vast body of knowledge on RCA:
Wikipedia,
SWEBOK,
CMMI. This
site provides useful background information to tackle root cause analysis that I won't detail here. Measuring quality & defects go hand-in-hand: if the trends reflect an unusual increase in defects, or your test results produce fluctuating reports (e.g. constant but erratic regressions) and you detect general ambivalence from various teams, then those are your typical clues to instigate further investigation - to root out the causes of the fundamental problems.
RCA is all about learning from previous problems, seeking out ways to prevent similar problems from recurring in future, or at least will help you spot problems sooner than later. By carrying out RCA the project teams (developers, testers, integrators) themselves have an opportunity to learn some very specific lessons relevant to the way they work, whilst the management team takes the big picture view in identifying areas to improve the processes in those areas.
In the area of RCA for defect management, there is a large reliance on availability of data. The data is your starting point for the first pass analysis. Mining data from your defect tracking tool, you can look for clues: provided the defect tool is being used correctly. Hence further emphasising the need for a clear Defect Management Policy that imposes rules on how the defect tool should be used, the mandatory fields of information, guidelines of what engineers/testers should communicate, etc. Many technical people (developers/integrators/testers) often make the mistake of assuming defect tracking systems as an annoyance - administrative burden - and seek ways to reduce the time spent, for example: automating the import of information. Whilst there's nothing wrong with automation, RCA seeks out worthwhile information: What went wrong, How did you fix it, What was the inherent cause for the defect, etc. Spending a little time explaining the situation in the defect record not only provides valuable information to the RCA administrator, but also would save time for people investigating similar defects in future.
Assuming you have a mature Defect Management System in place, the next step is to ensure your project or organisation is receptive to doing RCA, as it is a fairly intensive process, requiring access to your project's database, and access to engineers/testers - as much of the interaction is personal and through meetings (there is only so much one can infer from data metrics. To get to the bottom of the problem, a face-to-face, heart-to-heart is required). You need to be ready to implement corrective actions that, if implemented correctly, will prevent certain defects from recurring.
I've not actively managed an RCA process myself, although I did instigate the activity in the past; and contributed information to facilitate the process. My part is more an observer however, as mentioned previously we had a specialist Quality expert that managed RCA for the example project - I'll share a few snippets of info here, since I'm sure all DTV projects will experience much the same.
The
picture below is just one example of RCA metrics worth reporting:
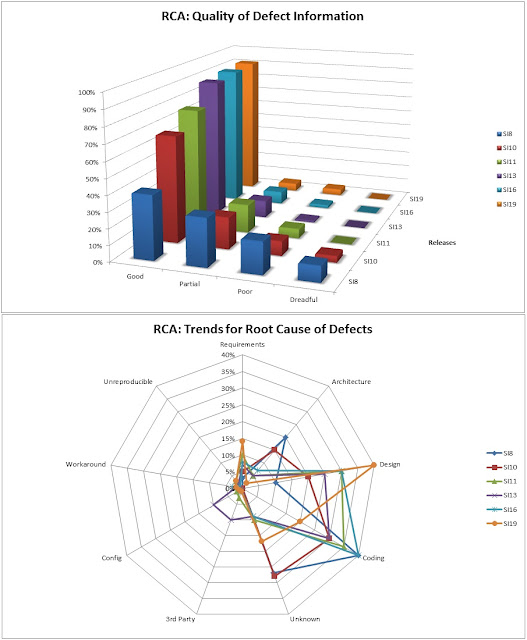 |
| RCA Trends: (Top) Quality of Defect Info - (Bottom) Root Causes Assignments |
The above example illustrates the tracking of RCA over a period of time (11 SI releases, releases a 3 week cycle, so 33 weeks of data). Based on the analysis and feedback, we unearthed the following problems/resolutions:
- Quality of Defect Information captured in problem reports needed much improvement
- Instigated stricter defect reviews, the daily scrub process rejected poor quality information, assigning defects back to the submitter requesting missing information.
- Component Design Flaws
- Project management team enforced stricter controls over the "Definition-of-Done": Design reviews and sign-off required
- Coding Mistakes / Errors
- Project management team drove through code review training exercises
- Code Review training became mandatory learning
- Introduced further code quality checking into continuous integration system (measuring complexity)
- Introduced Static Analysis Coding Tools to identify and trap hard-to-find defects; consequently the static analysis tool in itself was used to train engineers
- Ensure test harnesses and tools are free of compiler and MISRA warnings themselves
- Mandatory memory leak testing & tools introduced as part of release process
- Better use of Code Review techniques
- Peer programming
- Face-to-Face review
- Use online code review tool to facilitate collaboration
- Open the code review to teams outside project (worked well to a point)
- Too much pressure from project management
- Defects take time to investigate and resolve, sometimes this is not appreciated by the management team.
- PMs acted as deflectors to customer, buffering as much as possible leaving the engineers alone to focus on fixing critical issues
- Architecture / Requirements
- As part of architecture design, introduced section to detail specific error handling conditions
- Improve system-wide knowledge across the project team
- Reduce the component-silo approach to working
- Reduce conflicting requirements by ensuring cross project architecture reviews
- Aim to reduce ambiguity or "open to interpretation of implementer" in interface specifications
- Prevent defects in requirements in the coding/testing phases because it's a costly affair - instill stricter requirements reviews, often involved multi-project architects to avoid conflicting requirements
- Other / Unreproducible
- Ensure test bit-streams match desired specification and don't defer to live stream
So if you're delivering software components to a STB/DTV delivery, and your components have a significant development phase, it is worth you planning in strategic points for RCA, as a way to improve your overall quality of your deliverable!
This piece of course will not be complete if I don't mention the classic, oft repeated and
self-explanatory model of the cost-of-fixing-defects through different stages of the project:
Conclusions
Defect Management is a key component of managing a DTV programme. Measuring quality by means of defect metrics targeting clear milestone criteria is an effective way of tracking the progress of the project, the information can be used in various ways to communicate how far or close you're away from/to reaching the launch requirements. There is a wealth of information around Software Quality Engineering; I've shared some experiences that have proven to be effective in real world projects. Always keep a realistic hat on, avoid overkill and the pitfall of applying process-for-process-sake. Instead focus on the measurements that count, and depending on the growth or strategy of your organisation, think about applying some of the best practices in the background, without jeopardising your current project commitments, treating it as an investment to better improve your future projects....
I've presented a somewhat detailed approach to Quality Control for DTV Projects. I hope you can take away from this the following points, in no particular order:
- Walk-the-Talk (Implement the theory practically and see real results)
- Have Accountability (Assign a custodian to the enforcing the quality deliverable)
- Enforce Process at All Stages (Find the right balance of process and be diligent about it)
- Ensure Feedback and Lessons Learnt (Metrics reporting and Root Cause Analysis)
- Get buy-in throughout the value chain (Your Programme team must accept this approach to Quality)
- Make sure you measure the right aspects (The value-add)
- Don't forget the business objectives (NFRs), adjusting the process based on the level of quality required
- If you get it wrong it's going to cost you time and money - and possibly your position in the market (Lean on people who've done this before)
Disclaimer: The views expressed in this post are based solely on my own professional experience and opinion (drawing upon both past and present projects). Whilst I've based the information on a real-world project, the data was normalised and kept generic-enough not to implicate/breach any company-sensitive policies (in the interest of professional knowledge-sharing).


